IFCN Combined World Milk Price Indicator

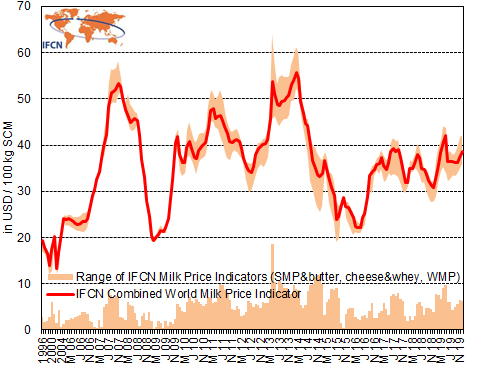
IFCN Combined World Milk Price Indicator: Based on the weighted average of 3 IFCN world milk price indicators: 1. SMP & butter (~32%), 2. Cheese & whey (~51%), 3. WMP (~17%), based on quarterly updated shares of the related commodities traded on the world market.
Latest update: 19.12.2019
Data table: IFCN World Milk Price Indicator in USD / 100 kg SCM*
(*Solid Corrected Milk: 4.0% fat, 3.3% protein)
| Jan | Feb | Mar | Apr | May | Jun | Jul | Aug | Sept | Oct | Nov | Dec | |
| 2006 | 23.9 | 24.0 | 23.9 | 23.3 | 23.0 | 22.8 | 22.9 | 23.1 | 23.2 | 24.0 | 25.9 | 29.1 |
| 2007 | 30.3 | 32.4 | 34.1 | 37.1 | 40.1 | 42.8 | 49.1 | 51.9 | 52.1 | 52.4 | 53.7 | 52.8 |
| 2008 | 50.2 | 47.9 | 46.9 | 45.0 | 45.3 | 45.6 | 45.3 | 42.0 | 36.8 | 32.9 | 28.0 | 24.4 |
| 2009 | 20.3 | 19.3 | 20.2 | 20.8 | 21.5 | 21.3 | 22.0 | 24.2 | 28.5 | 32.5 | 40.7 | 41.7 |
| 2010 | 37.8 | 36.1 | 36.2 | 39.8 | 41.3 | 39.5 | 37.6 | 37.2 | 38.9 | 39.8 | 40.1 | 40.7 |
| 2011 | 44.2 | 47.7 | 48.2 | 46.1 | 46.5 | 46.7 | 45.4 | 43.9 | 42.5 | 40.8 | 40.6 | 41.2 |
| 2012 | 41.6 | 40.9 | 39.5 | 37.0 | 35.2 | 34.3 | 33.9 | 35.2 | 38.0 | 39.3 | 39.5 | 39.9 |
| 2013 | 40.2 | 41.2 | 46.0 | 54.9 | 52.0 | 49.3 | 49.5 | 50.3 | 50.5 | 50.5 | 50.9 | 53.4 |
| 2014 | 54.4 | 56.0 | 54.7 | 49.5 | 46.8 | 44.6 | 43.8 | 39.2 | 35.9 | 34.8 | 33.3 | 33.0 |
| 2015 | 33.6 | 36.8 | 34.9 | 32.1 | 30.4 | 28.7 | 23.2 | 24.0 | 27.2 | 28.8 | 26.6 | 26.4 |
| 2016 | 25.4 | 24.1 | 22.4 | 22.2 | 22.1 | 24.2 | 25.1 | 28.7 | 33.3 | 34.1 | 34.8 | 35.8 |
| 2017 | 36.1 | 37.2 | 35.6 | 34.7 | 36.2 | 38.4 | 38.9 | 38.4 | 38.7 | 37.2 | 35.0 | 31.9 |
| 2018 | 31.9 | 35.0 | 35.1 | 36.1 | 37.9 | 37.1 | 34.9 | 34.4 | 33.4 | 32.2 | 31.3 | 30.9 |
| 2019 | 33.6 | 35.8 | 38.4 | 40.7 | 42.1 | 36.6 | 36.4 | 36.4 | 36.2 | 36.2 | 37.4 | 38.5 |
Combined IFCN World Milk Price Indicator illustrates the world market price level for milk. It represents the milk price a milk processor could theoretically pay to its farmers, if it was selling its products on the world spot market and producing at standardised costs. A wide range between IFCN World Milk Price Indicators indicates economic stress for specialised dairies, if their main product is trading at the lower bound of the range.
It is based on the weighted average of 3 IFCN world milk price indicators: 1. SMP & butter (~32%), 2. Cheese & whey (~51%), 3. WMP (~17%), based on quarterly updated shares of the related commodities traded on the world market.
Data Table: Trade shares per quarter
| Q1 | Q2 | Q3 | Q4 | |||||||||
SMP&Butter |
Cheese&Whey |
WMP |
SMP&Butter |
Cheese&Whey |
WMP |
SMP&Butter |
Cheese&Whey |
WMP |
SMP&Butter |
Cheese&Whey |
WMP |
|
| 2006 | 0.31 | 0.50 | 0.19 | 0.32 | 0.49 | 0.19 | 0.32 | 0.52 | 0.16 | 0.33 | 0.50 | 0.17 |
| 2007 | 0.31 | 0.50 | 0.19 | 0.32 | 0.52 | 0.15 | 0.29 | 0.57 | 0.14 | 0.30 | 0.52 | 0.18 |
| 2008 | 0.30 | 0.52 | 0.18 | 0.31 | 0.52 | 0.17 | 0.29 | 0.55 | 0.16 | 0.29 | 0.51 | 0.20 |
| 2009 | 0.31 | 0.50 | 0.19 | 0.32 | 0.50 | 0.18 | 0.30 | 0.53 | 0.17 | 0.32 | 0.50 | 0.18 |
| 2010 | 0.30 | 0.51 | 0.19 | 0.31 | 0.51 | 0.18 | 0.31 | 0.54 | 0.16 | 0.32 | 0.48 | 0.19 |
| 2011 | 0.31 | 0.49 | 0.20 | 0.31 | 0.51 | 0.18 | 0.30 | 0.55 | 0.15 | 0.31 | 0.50 | 0.19 |
| 2012 | 0.29 | 0.47 | 0.24 | 0.31 | 0.51 | 0.18 | 0.30 | 0.52 | 0.18 | 0.32 | 0.50 | 0.18 |
| 2013 | 0.31 | 0.49 | 0.19 | 0.31 | 0.53 | 0.16 | 0.31 | 0.54 | 0.15 | 0.32 | 0.47 | 0.21 |
| 2014 | 0.32 | 0.48 | 0.20 | 0.33 | 0.50 | 0.17 | 0.32 | 0.54 | 0.14 | 0.32 | 0.48 | 0.19 |
| 2015 | 0.33 | 0.48 | 0.19 | 0.33 | 0.51 | 0.16 | 0.33 | 0.52 | 0.15 | 0.33 | 0.47 | 0.19 |
| 2016 | 0.34 | 0.49 | 0.17 | 0.33 | 0.50 | 0.17 | 0.33 | 0.53 | 0.14 | 0.33 | 0.49 | 0.18 |
| 2017 | 0.32 | 0.51 | 0.17 | 0.33 | 0.52 | 0.16 | 0.32 | 0.54 | 0.13 | 0.32 | 0.50 | 0.18 |
| 2018 | 0.33 | 0.50 | 0.17 | 0.34 | 0.51 | 0.15 | 0.33 | 0.53 | 0.14 | 0.33 | 0.48 | 0.19 |
| 2019 | 0.35 | 0.44 | 0.20 | 0.30 | 0.56 | 0.15 | 0.33 | 0.53 | 0.14 | 0.33 | 0.48 | 0.19 |
Latest Update: 30.10.2019
*In order to be able to show comparable outputs, the IFCN converts all milk with natural contents into solid corrected milk (SCM). Thus, milk outputs with 4.0% fat and 3.3% protein are generated. The formula applied is:
SCM = milk production * (fat % + true protein %) / 7.3
IFCN World Feed Price Indicator

Latest update: 19.12.2019
Data Table: IFCN World Feed Price Indicator in USD / 100 kg
| Jan | Feb | Mar | Apr | May | Jun | Jul | Aug | Sept | Oct | Nov | Dec | |
| 2006 | 13.2 | 13.4 | 13.1 | 13.3 | 13.5 | 13.6 | 13.6 | 13.3 | 13.7 | 15.8 | 17.9 | 17.4 |
| 2007 | 18.2 | 19.7 | 19.1 | 17.3 | 17.8 | 19.0 | 17.9 | 18.1 | 19.9 | 20.5 | 21.4 | 23.2 |
| 2008 | 25.7 | 27.3 | 27.8 | 28.5 | 28.1 | 33.2 | 32.3 | 28.1 | 27.3 | 21.5 | 20.3 | 19.9 |
| 2009 | 22.3 | 21.0 | 21.0 | 22.3 | 24.9 | 25.8 | 22.2 | 22.6 | 20.8 | 21.6 | 22.1 | 21.9 |
| 2010 | 21.5 | 20.4 | 19.9 | 20.3 | 20.6 | 20.1 | 21.5 | 22.5 | 24.4 | 27.1 | 27.8 | 29.2 |
| 2011 | 30.9 | 32.8 | 32.1 | 34.0 | 33.2 | 33.5 | 32.7 | 33.5 | 32.2 | 29.7 | 29.1 | 27.7 |
| 2012 | 29.5 | 30.5 | 31.8 | 32.4 | 32.6 | 32.6 | 39.9 | 40.8 | 39.2 | 38.1 | 37.2 | 36.3 |
| 2013 | 34.9 | 35.2 | 35.7 | 33.0 | 35.0 | 35.9 | 35.4 | 30.6 | 29.2 | 27.9 | 27.8 | 28.7 |
| 2014 | 28.1 | 29.6 | 30.8 | 31.6 | 31.5 | 29.8 | 26.3 | 25.8 | 23.7 | 22.8 | 25.2 | 25.0 |
| 2015 | 23.6 | 23.4 | 23.1 | 22.5 | 21.9 | 22.3 | 24.4 | 22.5 | 21.9 | 22.1 | 21.2 | 20.6 |
| 2016 | 20.2 | 19.9 | 20.0 | 21.3 | 24.0 | 25.9 | 23.4 | 21.4 | 20.7 | 20.8 | 21.0 | 21.1 |
| 2017 | 22.1 | 22.5 | 21.8 | 21.2 | 21.3 | 21.0 | 21.7 | 20.3 | 20.4 | 20.8 | 20.9 | 21.1 |
| 2018 | 21.7 | 23.4 | 24.4 | 24.9 | 25.2 | 23.0 | 21.9 | 22.0 | 21.1 | 21.6 | 21.4 | 21.9 |
| 2019 | 22.0 | 22.0 | 21.7 | 21.4 | 21.8 | 24.2 | 23.4 | 21.2 | 20.7 | 21.8 | 21.6 | 21.5 |
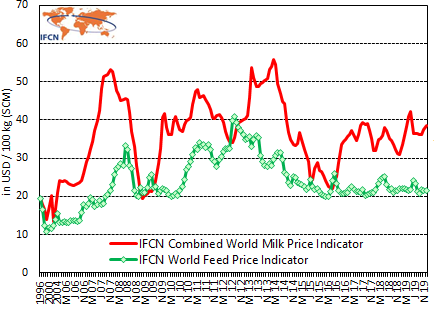
The IFCN World Feed Price Indicator represents the world market price level for feed. It is based on the prices for soybean meal and corn, originating from their shares in a simplified compound feed ration.
Milk: feed price ratio indicator

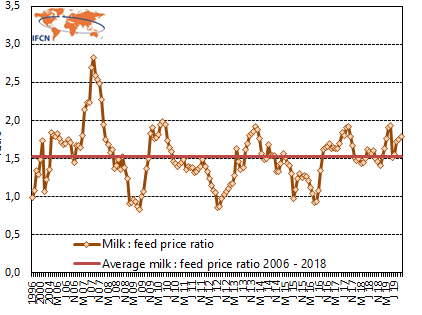
The milk:feed price ratio is defined as milk price divided by the price of purchased feed (IFCN Combined World Milk Price Indicator / IFCN World Feed Price Indicator).
In a simplified form it shows how much feed (kg concentrates) a farmer can buy after selling one kg of milk. A milk:feed price ratio >1.5 is considered favourable, in this case high yield / high input systems can be used. In simple terms, the higher the ratio is, the more economical it is to use concentrates.
Join the IFCN Network
If you would like to find out more about how to be involved, and what are the expected inputs and deliveries from IFCN please do not hesitate to contact the IFCN Dairy Network directly via mail info@ifcndairy.org or fill out the form below.
