1. IFCN Monthly Public Indicators
IFCN Combined World Milk Price Indicator

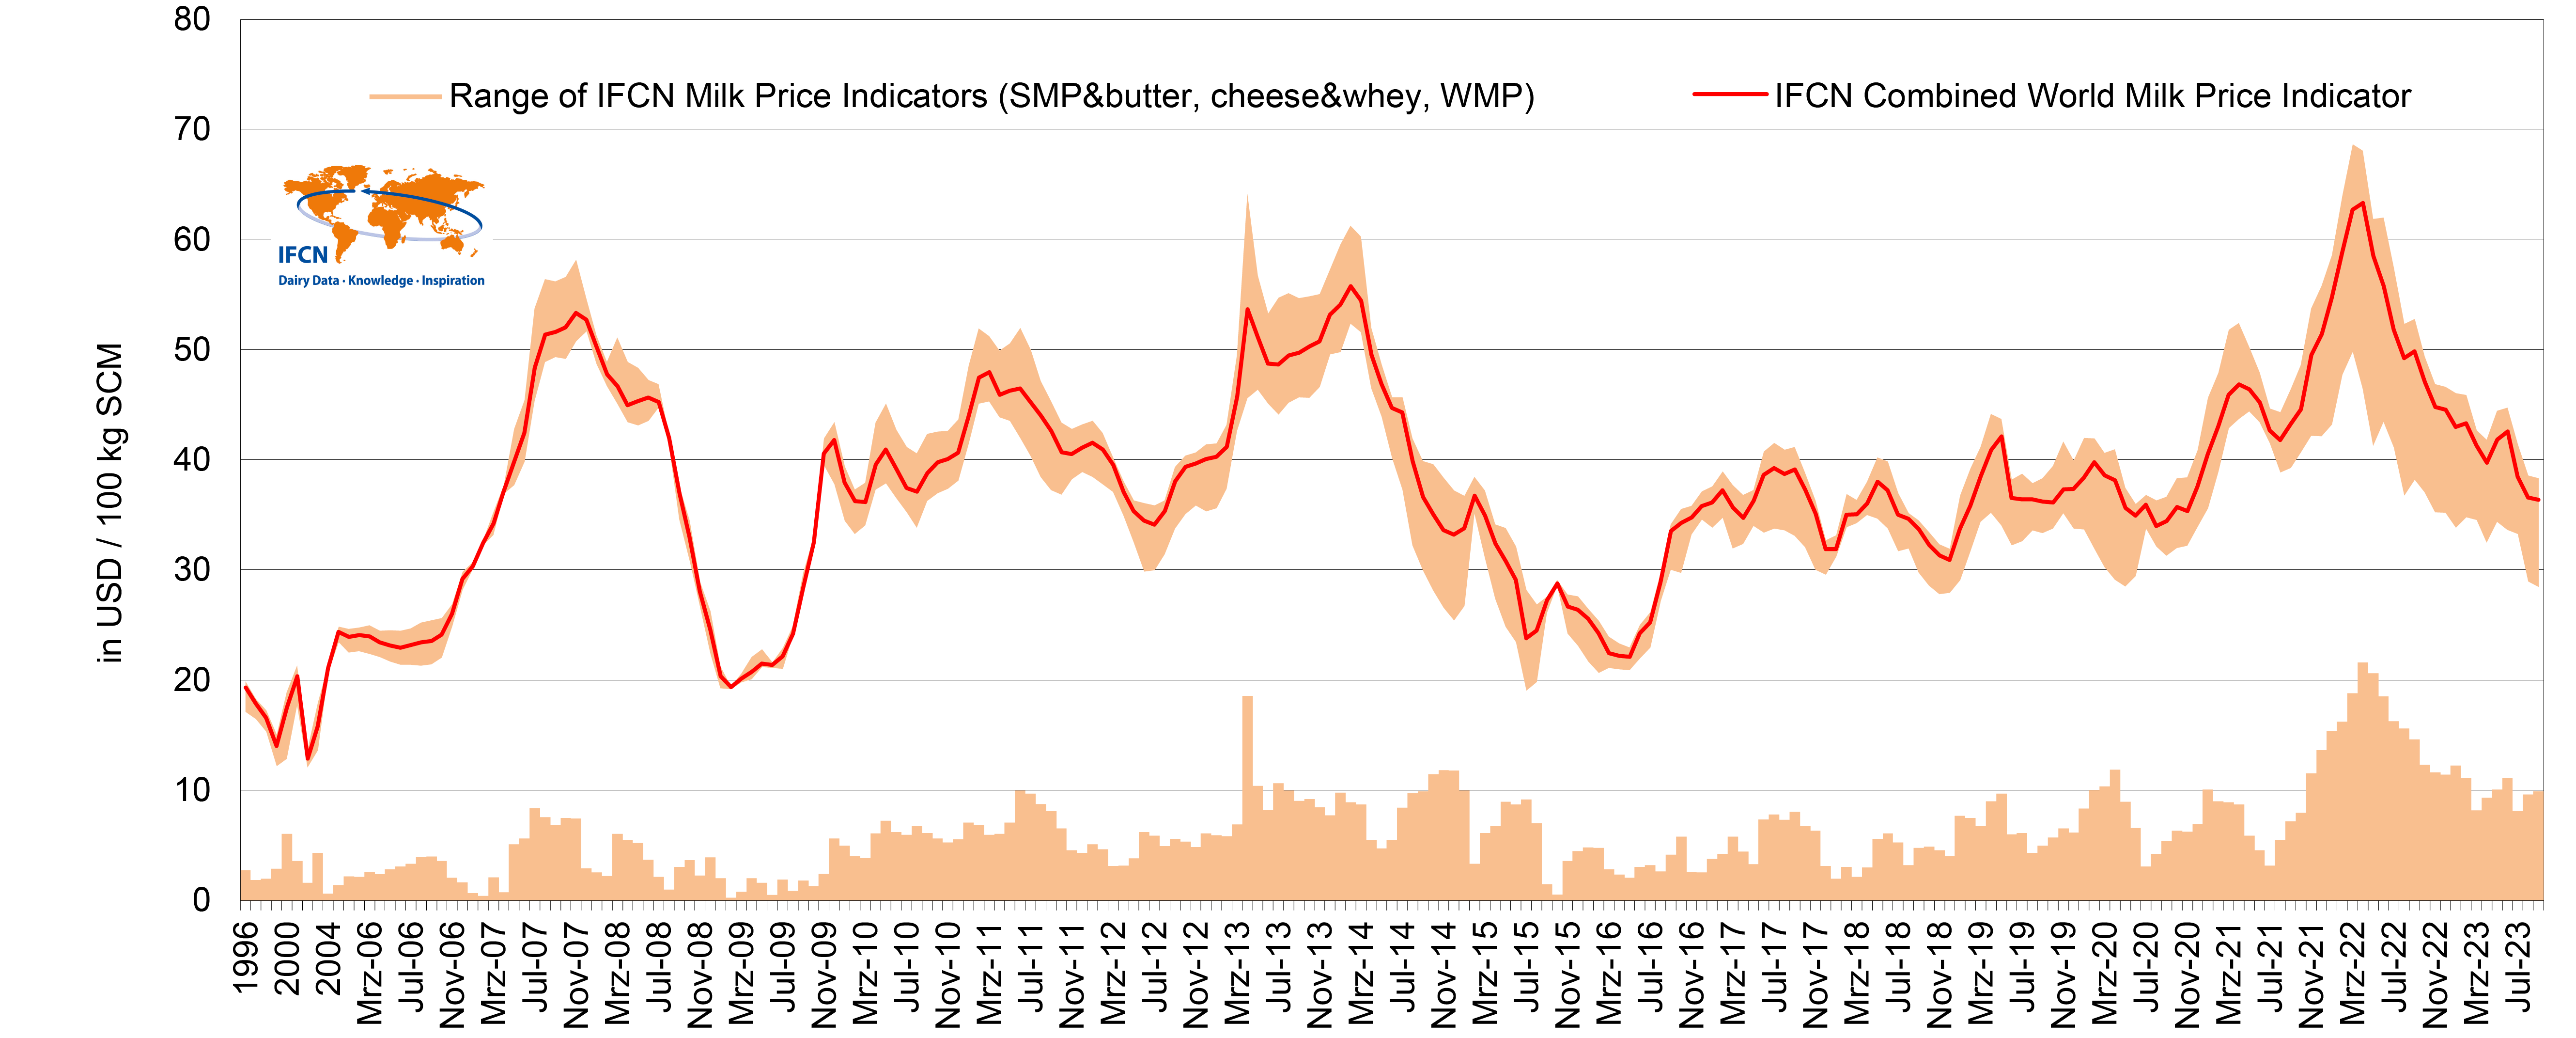
IFCN Combined World Milk Price Indicator: Based on the weighted average of 3 IFCN world milk price indicators: 1. SMP & butter (~32%), 2. Cheese & whey (~51%), 3. WMP (~17%), based on quarterly updated shares of the related commodities traded on the world market.
Latest update: 6.6.2024
Data table: IFCN World Milk Price Indicator in USD / 100 kg SCM*
(*Solid Corrected Milk: 4.0% fat, 3.3% protein)
| Jan | Feb | Mar | Apr | May | Jun | Jul | Aug | Sept | Oct | Nov | Dec | |
| 2006 | 23.9 | 24.1 | 23.9 | 23.4 | 23.1 | 22.9 | 23.1 | 23.4 | 23.5 | 24.1 | 26.0 | 29.2 |
| 2007 | 30.3 | 32.5 | 34.2 | 37.1 | 39.7 | 42.4 | 48.3 | 51.3 | 51.5 | 52.0 | 53.3 | 52.7 |
| 2008 | 50.2 | 47.7 | 46.7 | 45.0 | 45.4 | 45.7 | 45.2 | 42.0 | 36.6 | 33.0 | 28.0 | 24.6 |
| 2009 | 20.4 | 19.3 | 20.1 | 20.8 | 21.5 | 21.4 | 22.2 | 24.2 | 28.5 | 32.5 | 40.6 | 41.8 |
| 2010 | 37.9 | 36.2 | 36.1 | 39.5 | 40.9 | 39.2 | 37.4 | 37.1 | 38.8 | 39.8 | 40.1 | 40.6 |
| 2011 | 43.9 | 47.4 | 47.9 | 45.9 | 46.2 | 46.4 | 45.2 | 44.0 | 42.6 | 40.7 | 40.5 | 41.1 |
| 2012 | 41.5 | 40.9 | 39.5 | 37.0 | 35.3 | 34.5 | 34.1 | 35.3 | 38.0 | 39.3 | 39.6 | 40.0 |
| 2013 | 40.3 | 41.2 | 45.7 | 53.7 | 51.2 | 48.7 | 48.7 | 49.5 | 49.7 | 50.3 | 50.7 | 53.2 |
| 2014 | 54.1 | 55.8 | 54.4 | 49.5 | 46.9 | 44.7 | 43.3 | 39.9 | 36.6 | 35.0 | 33.6 | 33.2 |
| 2015 | 33.8 | 36.8 | 34.9 | 32.4 | 30.8 | 29.1 | 23.8 | 24.5 | 27.3 | 28.7 | 26.7 | 26.4 |
| 2016 | 25.5 | 24.2 | 22.4 | 22.2 | 22.1 | 24.3 | 25.2 | 28.9 | 33.5 | 34.3 | 34.8 | 35.8 |
| 2017 | 36.1 | 37.2 | 35.7 | 34.7 | 36.3 | 38.6 | 39.2 | 38.7 | 39.1 | 37.3 | 35.1 | 31.9 |
| 2018 | 31.9 | 35.0 | 35.0 | 36.0 | 38.0 | 37.2 | 35.0 | 34.6 | 33.7 | 32.2 | 31.3 | 30.9 |
| 2019 | 33.7 | 35.9 | 38.5 | 40.9 | 42.1 | 36.5 | 36.4 | 36.4 | 36.2 | 36.1 | 37.3 | 37.4 |
| 2020 | 38.3 | 39.9 | 38.7 | 38.1 | 35.6 | 34.9 | 36.0 | 33.9 | 34.5 | 35.7 | 35.2 | 37.4 |
| 2021 | 40.5 | 43.0 | 45.9 | 46.8 | 46.4 | 45.2 | 42.6 | 41.7 | 43.1 | 44.4 | 49.5 | 51.5 |
| 2022 | 54.7 | 58.8 | 62.7 | 63.4 | 58.5 | 55.8 | 51.8 | 49.2 | 49.8 | 46.6 | 44.3 | 44.0 |
| 2023 | 42.8 | 43.2 | 41.1 | 39.6 | 41.8 | 43.7 | 38.4 | 36.5 | 36.4 | 37.2 | 38.0 | 39.4 |
| 2024 | 40.9 | 43.0 | 42.1 | 42.3 | 43.0 |
Combined IFCN World Milk Price Indicator illustrates the world market price level for milk. It represents the milk price a milk processor could theoretically pay to its farmers, if it was selling its products on the world spot market and producing at standardised costs. A wide range between IFCN World Milk Price Indicators indicates economic stress for specialised dairies, if their main product is trading at the lower bound of the range.
It is based on the weighted average of 3 IFCN world milk price indicators: 1. SMP & butter (~32%), 2. Cheese & whey (~51%), 3. WMP (~17%), based on quarterly updated shares of the related commodities traded on the world market.
Data Table: Trade shares per quarter
| Q1 | Q2 | Q3 | Q4 | |||||||||
SMP&Butter |
Cheese&Whey |
WMP |
SMP&Butter |
Cheese&Whey |
WMP |
SMP&Butter |
Cheese&Whey |
WMP |
SMP&Butter |
Cheese&Whey |
WMP |
|
| 2006 | 0.31 | 0.50 | 0.19 | 0.32 | 0.49 | 0.19 | 0.32 | 0.52 | 0.16 | 0.33 | 0.50 | 0.17 |
| 2007 | 0.31 | 0.50 | 0.19 | 0.32 | 0.52 | 0.15 | 0.29 | 0.57 | 0.14 | 0.30 | 0.52 | 0.18 |
| 2008 | 0.30 | 0.52 | 0.18 | 0.31 | 0.52 | 0.17 | 0.29 | 0.55 | 0.16 | 0.29 | 0.51 | 0.20 |
| 2009 | 0.31 | 0.50 | 0.19 | 0.32 | 0.50 | 0.18 | 0.30 | 0.53 | 0.17 | 0.32 | 0.50 | 0.18 |
| 2010 | 0.30 | 0.51 | 0.19 | 0.31 | 0.51 | 0.18 | 0.31 | 0.54 | 0.16 | 0.32 | 0.48 | 0.19 |
| 2011 | 0.31 | 0.49 | 0.20 | 0.31 | 0.51 | 0.18 | 0.30 | 0.55 | 0.15 | 0.31 | 0.50 | 0.19 |
| 2012 | 0.29 | 0.47 | 0.24 | 0.31 | 0.51 | 0.18 | 0.30 | 0.52 | 0.18 | 0.32 | 0.50 | 0.18 |
| 2013 | 0.31 | 0.49 | 0.19 | 0.31 | 0.53 | 0.16 | 0.31 | 0.54 | 0.15 | 0.32 | 0.47 | 0.21 |
| 2014 | 0.32 | 0.48 | 0.20 | 0.33 | 0.50 | 0.17 | 0.32 | 0.54 | 0.14 | 0.32 | 0.48 | 0.19 |
| 2015 | 0.33 | 0.48 | 0.19 | 0.33 | 0.51 | 0.16 | 0.33 | 0.52 | 0.15 | 0.33 | 0.47 | 0.19 |
| 2016 | 0.34 | 0.49 | 0.17 | 0.33 | 0.50 | 0.17 | 0.33 | 0.53 | 0.14 | 0.33 | 0.49 | 0.18 |
| 2017 | 0.32 | 0.51 | 0.17 | 0.33 | 0.52 | 0.16 | 0.32 | 0.54 | 0.13 | 0.32 | 0.50 | 0.18 |
| 2018 | 0.33 | 0.50 | 0.17 | 0.34 | 0.51 | 0.15 | 0.33 | 0.53 | 0.14 | 0.33 | 0.48 | 0.19 |
| 2019 | 0.35 | 0.48 | 0.17 | 0.30 | 0.56 | 0.14 | 0.29 | 0.59 | 0.11 | 0.30 | 0.55 | 0.15 |
| 2020 | 0.30 | 0.55 | 0.15 | 0.34 | 0.50 | 0.16 | 0.32 | 0.54 | 0.14 | 0.31 | 0.50 | 0.19 |
| 2021 | 0.32 | 0.50 | 0.18 | 0.33 | 0.51 | 0.17 | 0.26 | 0.64 | 0.11 | 0.27 | 0.59 | 0.14 |
| 2022 | 0.33 | 0.51 | 0.16 | 0.32 | 0.53 | 0.15 | 0.29 | 0.59 | 0.12 | 0.32 | 0.50 | 0.18 |
Latest Update: 28.03.2023
*In order to be able to show comparable outputs, the IFCN converts all milk with natural contents into solid corrected milk (SCM). Thus, milk outputs with 4.0% fat and 3.3% protein are generated. The formula applied is:
SCM = milk production * (fat % + true protein %) / 7.3
IFCN World Feed Price Indicator

Latest update: 6.6.2024
Data Table: IFCN World Feed Price Indicator in USD / 100 kg
| Jan | Feb | Mar | Apr | May | Jun | Jul | Aug | Sept | Oct | Nov | Dec | |
| 2006 | 13.2 | 13.4 | 13.1 | 13.3 | 13.5 | 13.6 | 13.6 | 13.3 | 13.7 | 15.8 | 17.9 | 17.4 |
| 2007 | 18.2 | 19.7 | 19.1 | 17.3 | 17.8 | 19.0 | 17.9 | 18.1 | 19.9 | 20.5 | 21.4 | 23.2 |
| 2008 | 25.7 | 27.3 | 27.8 | 28.5 | 28.1 | 33.2 | 32.3 | 28.1 | 27.3 | 21.5 | 20.3 | 19.9 |
| 2009 | 22.3 | 21.0 | 21.0 | 22.3 | 24.9 | 25.8 | 22.2 | 22.6 | 20.8 | 21.6 | 22.1 | 21.9 |
| 2010 | 21.5 | 20.4 | 19.9 | 20.3 | 20.6 | 20.1 | 21.5 | 22.5 | 24.4 | 27.1 | 27.8 | 29.2 |
| 2011 | 30.9 | 32.8 | 32.1 | 34.0 | 33.2 | 33.5 | 32.7 | 33.5 | 32.2 | 29.7 | 29.1 | 27.7 |
| 2012 | 29.5 | 30.5 | 31.8 | 32.4 | 32.6 | 32.6 | 39.9 | 40.8 | 39.2 | 38.1 | 37.2 | 36.3 |
| 2013 | 34.9 | 35.2 | 35.7 | 33.0 | 35.0 | 35.9 | 35.4 | 30.6 | 29.2 | 27.9 | 27.8 | 28.7 |
| 2014 | 28.1 | 29.6 | 30.8 | 31.6 | 31.5 | 29.8 | 26.3 | 25.8 | 23.7 | 22.8 | 25.2 | 25.0 |
| 2015 | 23.6 | 23.4 | 23.1 | 22.5 | 21.9 | 22.3 | 24.4 | 22.5 | 21.9 | 22.1 | 21.2 | 20.6 |
| 2016 | 20.2 | 19.9 | 20.0 | 21.3 | 24.0 | 25.9 | 23.4 | 21.4 | 20.7 | 20.8 | 21.0 | 21.1 |
| 2017 | 22.1 | 22.5 | 21.8 | 21.2 | 21.3 | 21.0 | 21.7 | 20.3 | 20.4 | 20.8 | 20.9 | 21.1 |
| 2018 | 21.7 | 23.4 | 24.4 | 24.9 | 25.2 | 23.0 | 21.9 | 22.0 | 21.1 | 21.6 | 21.4 | 21.9 |
| 2019 | 22.0 | 22.0 | 21.7 | 21.4 | 21.8 | 24.2 | 23.4 | 21.2 | 20.7 | 21.8 | 21.6 | 21.5 |
| 2020 | 21.9 | 21.4 | 21.6 | 20.0 | 19.5 | 19.8 | 20.3 | 20.1 | 22.3 | 25.2 | 26.2 | 27.2 |
| 2021 | 31.1 | 31.3 | 30.7 | 32.4 | 35.1 | 32.9 | 31.4 | 29.7 | 27.7 | 27.4 | 29.1 | 31.3 |
| 2022 | 33.1 | 35.4 | 39.4 | 39.5 | 38.0 | 37.7 | 37.9 | 36.0 | 35.9 | 37.6 | 36.1 | 36.1 |
| 2023 | 36.8 | 37.1 | 35.3 | 35.3 | 32.6 | 32.1 | 31.2 | 28.6 | 28.7 | 28.5 | 29.4 | 27.7 |
| 2024 | 25.9 | 24.5 | 24.5 | 24.7 | 26.3 |
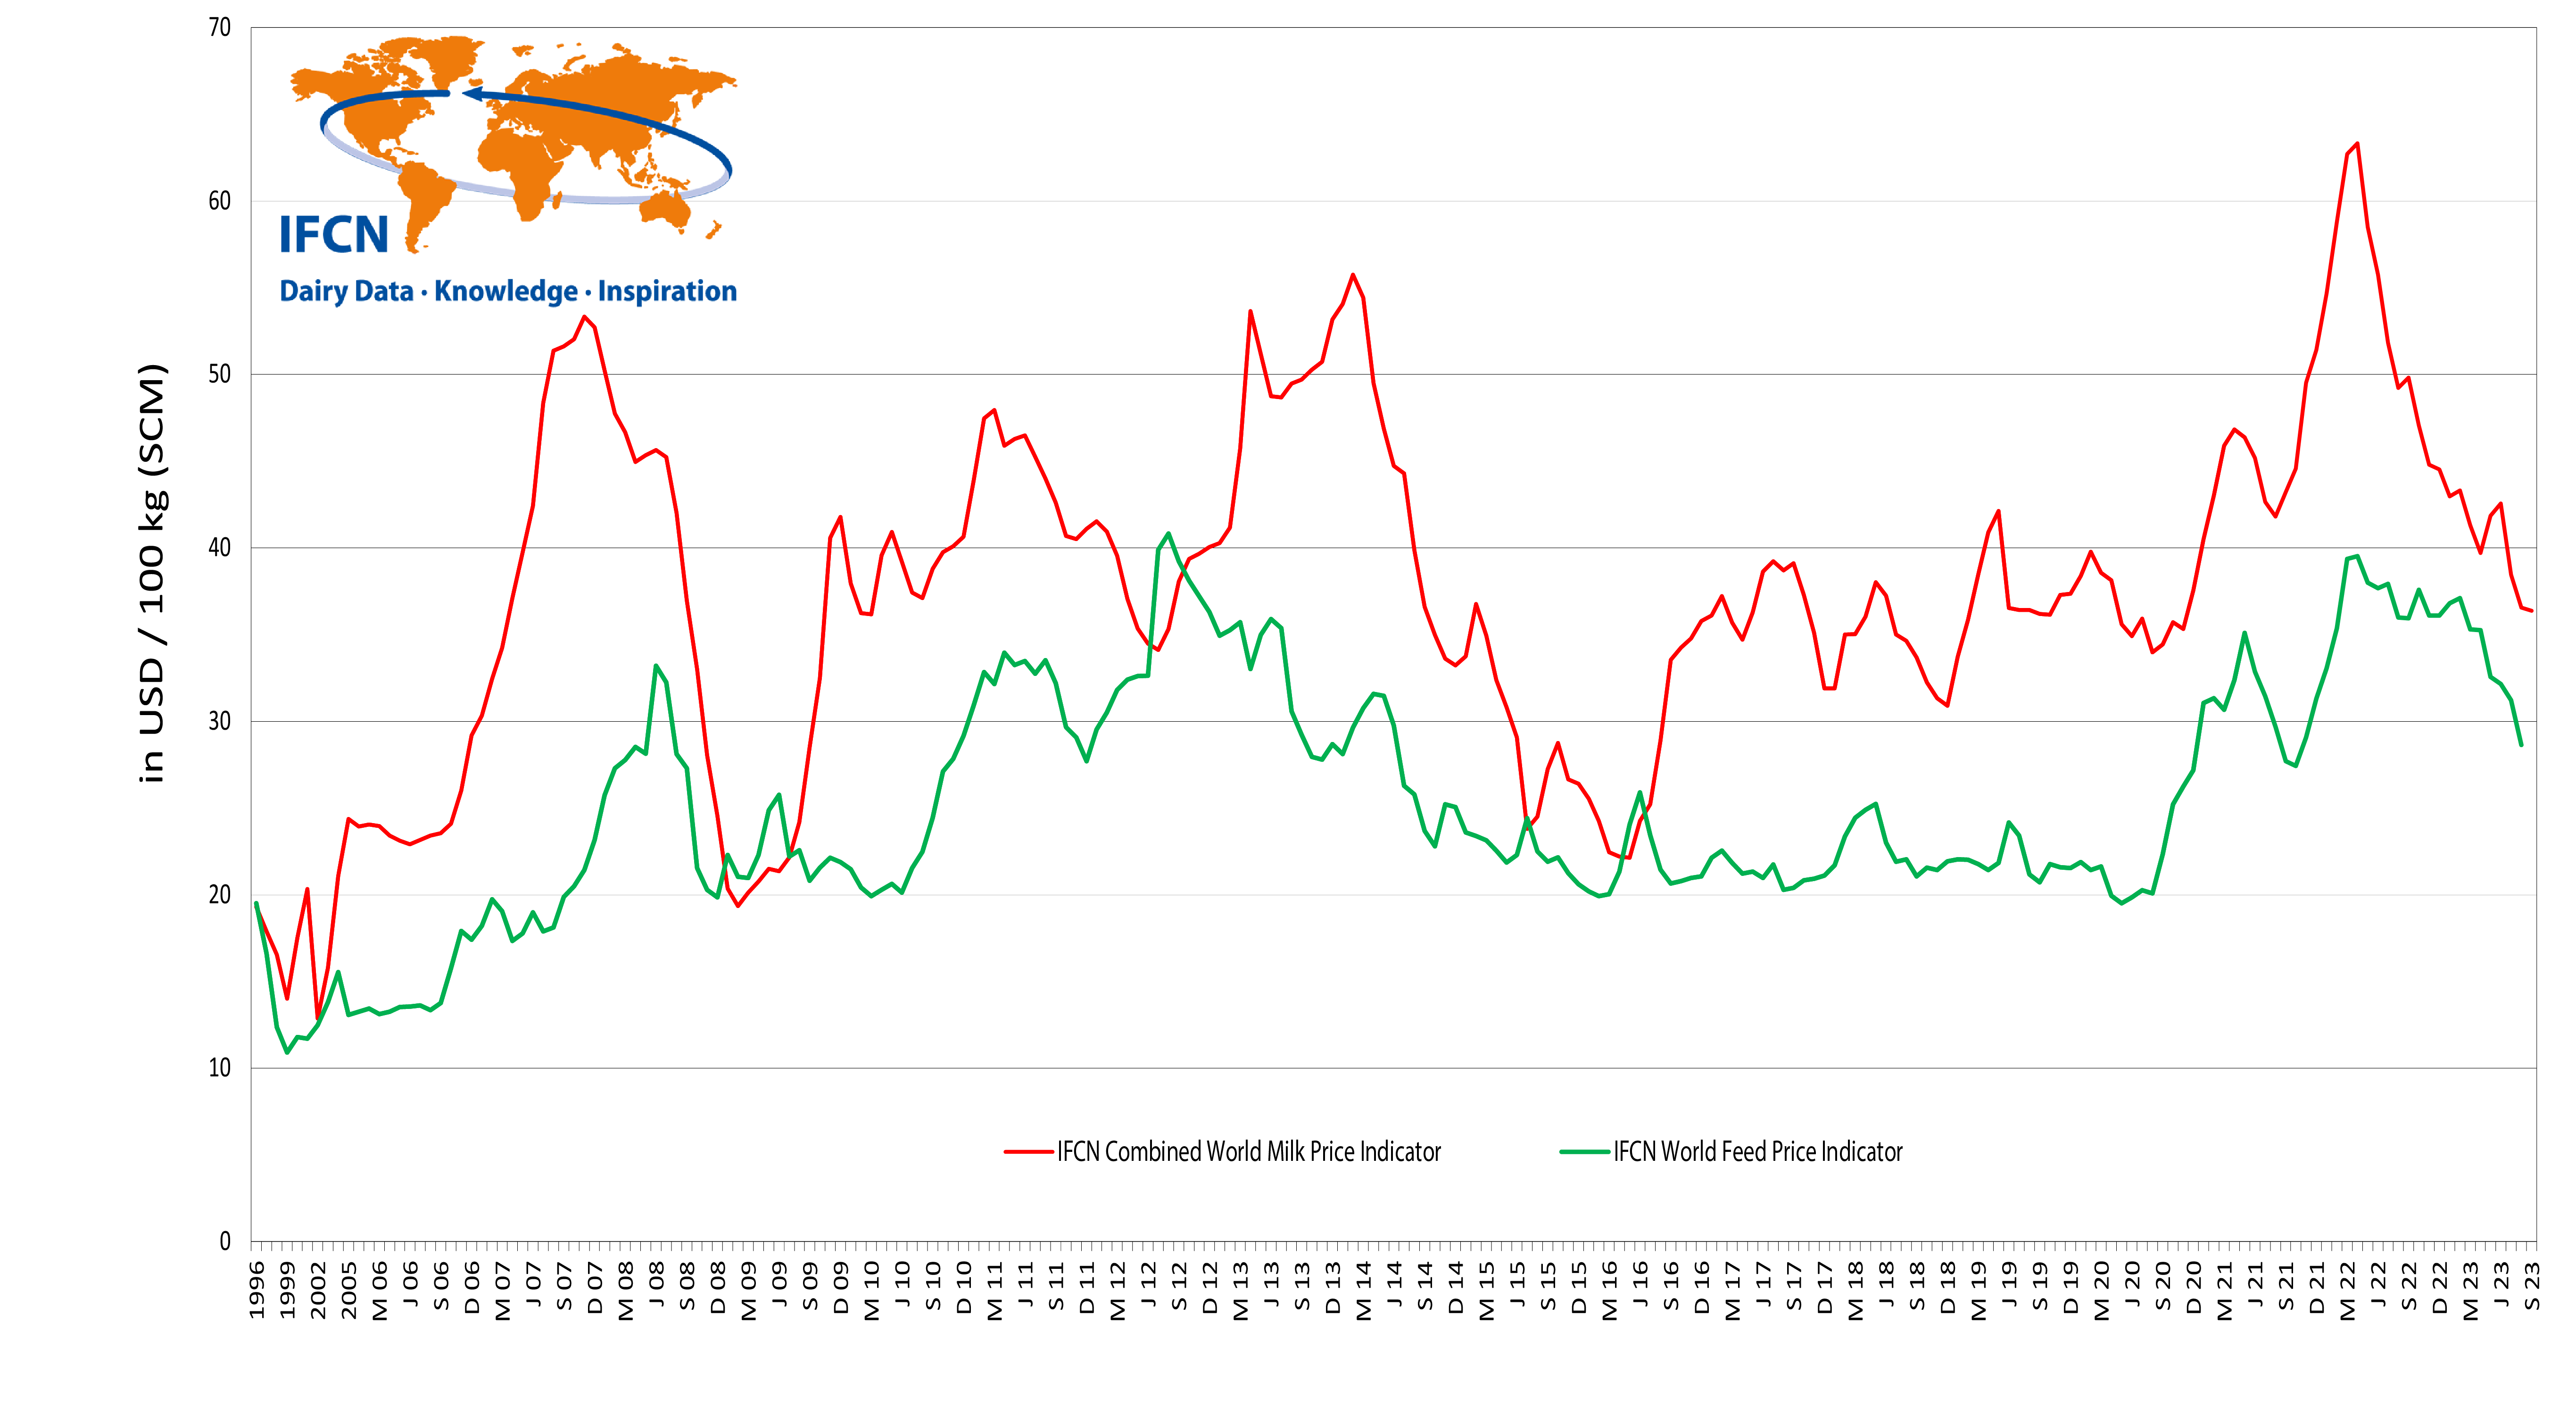
The IFCN World Feed Price Indicator represents the world market price level for feed. It is based on the prices for soybean meal and corn, originating from their shares in a simplified compound feed ration.
Milk: feed price ratio indicator
| Jan | Feb | Mar | Apr | May | Jun | Jul | Aug | Sept | Oct | Nov | Dec | |
| 2021 | 1.30 | 1.37 | 1.50 | 1.45 | 1.32 | 1.37 | 1.36 | 1.41 | 1.56 | 1.62 | 1.70 | 1.64 |
| 2022 | 1.65 | 1.66 | 1.59 | 1.61 | 1.54 | 1.48 | 1.37 | 1.37 | 1.39 | 1.24 | 1.23 | 1.22 |
| 2023 | 1.17 | 1.17 | 1.17 | 1.12 | 1.28 | 1.32 | 1.23 | 1.28 | 1.27 | 1.26 | 1.29 | 1.42 |
| 2024 | 1.6 | 1.8 | 1.7 | 1.7 | 1.6 |

Latest update: 06.10.2023
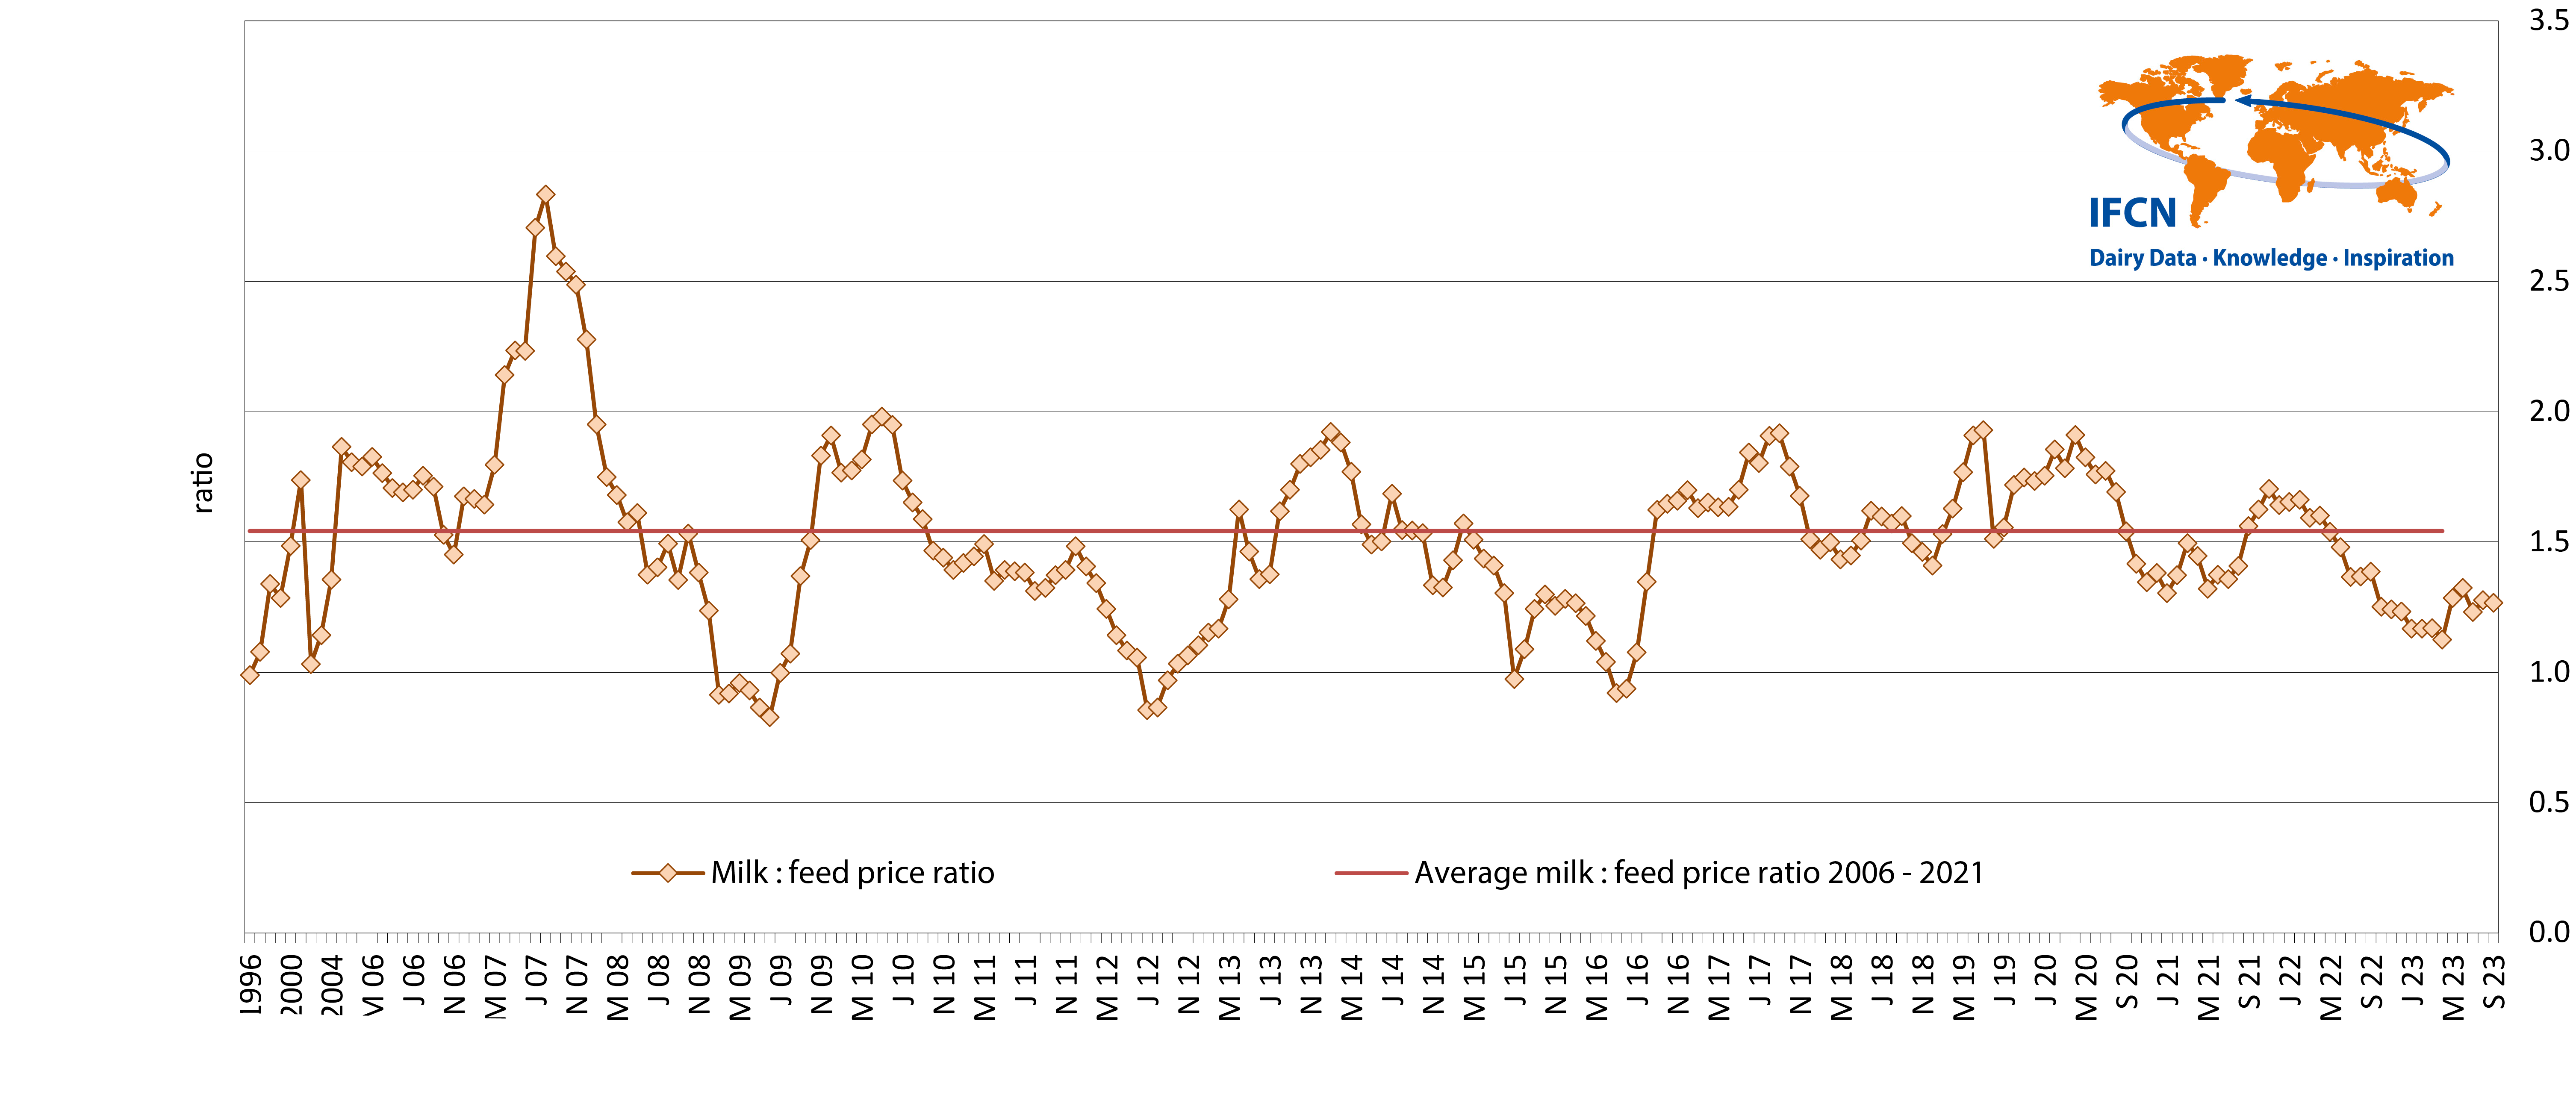
The milk:feed price ratio is defined as milk price divided by the price of purchased feed (IFCN Combined World Milk Price Indicator / IFCN World Feed Price Indicator).
In a simplified form it shows how much feed (kg concentrates) a farmer can buy after selling one kg of milk. A milk:feed price ratio >1.5 is considered favourable, in this case high yield / high input systems can be used. In simple terms, the higher the ratio is, the more economical it is to use concentrates.
2. IFCN Standardization
In its annual analysis IFCN relies on the following key standardization to ensure comparability of the global data used:
- Energy-corrected milk (SCM) adjustment: converting milk natural contents into energy corrected milk of 4.0% fat and 3.3% protein.
- Milk equivalents (ME): in simple words this conversion shows how much milk is used to produce one unit of a certain commodity. IFCN ME conversion is based on the selected “fat and protein” method.
- Conversion of litres to kilograms: IFCN applies metric values for mass rather than volume (1 litre = 1.033 kg).
3. IFCN Typical Farm Approach
The annual farm comparison activities of the IFCN are based on the Typical Farm Approach, the panel approach and the analysis with the TIPI-CAL Model.
In the IFCN, a typical dairy farm represents a certain production system, farm size, production technology used and the related milk volume in a country/dairy region. The first farm is normally an average sized farm with an average management performance. The second farm is larger but also with an average management performance, to show economies of scale. The approach of typical farms in combination with the panel approach (meeting of one to five farmers, one advisor and one scientist) has been proven to be very practical. Compared to statistical approaches, the advantage of the IFCN concept is that in-depth analysis is possible.
The TIPI-CAL Model (Technology Impact and Policy Impact Calculations) is an analytical tool for production, economic and environmental aspects of dairy farms. It was initially developed by Torsten Hemme (Hemme 2000). Since then it has been continuously refined by IFCN to suit recent challenges, including optional modules on green-house gas analysis, feed, water, risk analysis, farm supply reaction analysis and scenario modelling.
The core model allows to compare the typical farm data worldwide and also in different regions and countries, with farms of different sizes and legal forms, under different policy, market and technical scenarios. The TIPI-CAL enables the ranking of impacts of anticipated policies and farm strategies on dairy farms, hence serving as a dairy development guide.
